


INTRODUCTION
Noise is one of the most common causes of hearing loss (ConchaBarrientos et al., 2004). Noise is defined as unwanted sound and has specific characteristics of intensity duration and frequency, when the noise is intense and continuous, it causes permanent structural deteriorations in the inner ear which leads to noise induced hearing loss (NIHL) (Basner et al., 2014). NIHL is the irreversible damage to the hair cells of the inner ear following exposure to intense levels of noise. It may present as partial or total hearing loss and its severity depends primarily on the duration of noise exposure and sound intensity. It can either be a permanent threshold shift or temporary threshold shift. The World Health Organization estimates that 10% of the world population is exposed to sound pressure levels that could potentially cause NIHL. Among the worldwide adult population with disabling hearing loss, 16% were found to be associated with occupational noise (Nelson et al., 2005). Globally, contribution of occupational noise exposure to total deafness rate is approximately 7% in most developed countries and 21% in developing countries (Thorne et al., 2008).
NIHL is a public health problem. Global burden of disease 2010 estimated that 1.3 billion people are affected by hearing loss and investigators rated hearing loss as the 13th most important contributor. NIHL is generally sensorineural, bilateral, symmetrical and irreversible. It is often characterized by the gradual and progressive loss of hearing acuity due to the prolonged exposure to high noise levels, at more than 85 dBA for 8 hours a day (El Dib et al., 2008; Mihailović et al., 2016). Although noise has predominantly auditory effects such as ear fullness, NIHL, headache, tinnitus, ear fullness, dizziness, fatigue, non-auditory effects of it also have been identified as described by Basner et al.(2014). These non-auditory effects of noise include annoyance, sleep disturbances, cardiovascular disease, increased psychiatric illnesses, reduced performance and cognitive impairment.
Occupational noise exposure in USA was estimated to approximately 9 million of workers exposed to Time Weighted Average (TWA) sound levels of 85 dBA and above (Suter, 2000), with 10 million workers having NIHL > 25 dB HL (U.S. Department of Health and Human Services, 1998). In Sweden, 9% of workers are exposed to continuous hazardous noise level (Ivarsson et al., 1992), while 28% of workers in the European Union are exposed to sound levels of 85~90 dBA (European Agency for Safety and Health at Work, 2000). 40% of the manufacturing industry workers in Malaysia were exposed to noise levels of 86~90 dBA, with 10% affected with NIHL (Tahir et al., 2014) compared to 17% in Pakistan (Ashraf et al., 2009) and 24% in China. These values were 39%, 3%, and 28.2% in Iran, Taiwan, and Nigeria, respectively (Chang & Chang, 2009; Ologe et al., 2005; Soltanzadeh et al., 2014). The major industries in India responsible for excessive noise and exposing workers to hazardous levels of noise are textile, printing, sawmills, mining, laundry, etc. (Nandi & Dhatrak, 2008).
In Sri Lanka, laundry plants are at the top among the noisy work environments. The probability of hearing related disorders being present in laundry plant workers is very high due to the constant exposure to high noisy environment. Using hearing protective devices during work shifts and using low noise emitting machines are the possible suggestions to this problem but it is economically unfavorable for a developing country like Sri Lanka (Ministry of Transport, Environment and Women’s Affairs, 1996). Therefore, in order to address this issue, measuring noise levels at laundry plant premises as well as evaluating the hearing status of laundry plant workers would be a first step in making recommendations such as replacing noisy outdated machines currently in use.
MATERIALS AND METHODS
This was a descriptive cross-sectional study. Laundry plant workers engaged in different job categories between 20~55 years of age with at least 2 years of experience in the profession were recruited to the study. Laundry plant workers with external, middle, inner ear pathologies and balance disorders as well as who were already using personal hearing protective devices were excluded from the study.
Data collection was done via four main stages; measurement of noise, otoscopic examination and Oto Acoustc Emissions (OAE) screening (Guida et al., 2009), interviewer administered questionnaire and the diagnostic test battery.
Stage 1: measurement of noise
Sound level measurements were taken to measure the noise levels in each section within the laundry plant. Noise measurements were obtained mainly at pre-identified noisy areas at 15-minute intervals for 8 hours on 5 working days. The Rion NL – 52 class 01 sound level meter calibrated for the standards of International Electrotechnical Commission (IEC) 609442: 2003, was used to measure the sound levels within the laundry plant. Mathematical average of noise levels was calculated for each section and dose = [100 × T / 8 × 10 (Leq-85 / 10) % equation] used to calculate the noise dose in each section.
Stage 2: otoscopic examination & OAE screening test
Otoscopic examination was performed to identify any outer and/or middle ear conditions and laundry plant workers identified with such complications were excluded from the study. They were appropriately counseled and directed to appropriate medical intervention. The Distortion Product Otoacoustic Emission (DPOAE) screening test was administered bilaterally on each participant. The Natus Biologic AuDx Portable OAE Screener (Natus Medical Inc, Schaumburg, IL, USA) assesses frequencies of 2, 3, 4, and 5 kHz. The instrument indicates ‘refer’ when there is a cochlear hearing loss greater than 25~30 dBHL. DPOAE screening measurements were replicated for accuracy and reliability. The instrument was subjectively calibrated at the beginning of each testing day before being used on study participants. Four frequencies were tested for each ear and the DPOAE test results were considered to have ‘refer’ criterion if at least one frequency was referred during at least one out of two times of testing.
Stage 3: interviewer administered questionnaire
To gather information regarding the noise exposure and outcome of the noise exposure, an interviewer-administered questionnaire which included both closed-ended questions and open-ended questions were administered. The questions included the workers’ history of otologic conditions, ear surgeries, systematic and neurological diseases, long term usage of medication which could have affected the participants’ hearing, family history of hearing loss, previous occupational or non-occupational exposure to noise and current usage of hearing protective devices. The intervieweradministered questionnaire evaluated key areas of each participant’s hearing and hearing related status such as the subjective feeling of hearing loss, tinnitus, hyperacusis, diplacusis, dizziness and headaches.
Stage 4: diagnostic test battery
The diagnostic test battery was administered on participants selected from the 2nd stage of the study protocol. The participants were instructed to observe a mandatory 12-hour noise free period prior to the hearing tests and prior appointments were given for ease of convenience for them. The diagnostic test battery consisted of behavioral audiological assessments including Pure Tone Audiometry, Speech Audiometry and physiological assessments of tympanometry and distortion product oto acoustic emissions.
Data analysis
Descriptive and inferential statistics were performed to analyze data collected through the interviewer- administered questionnaire and screening and diagnostic hearing evaluations. The Shapiro Wilk test was used to establish normal distribution among variables. The chi-squared test was performed to determine the associated factors related to hearing status among laundry plant workers (p < 0.05).
RESULTS
One hundred seven laundry plant workers between 20 and 50 years of age with working experience of more than 2 years were included in this study. Among them 54 were male and 53 were female.
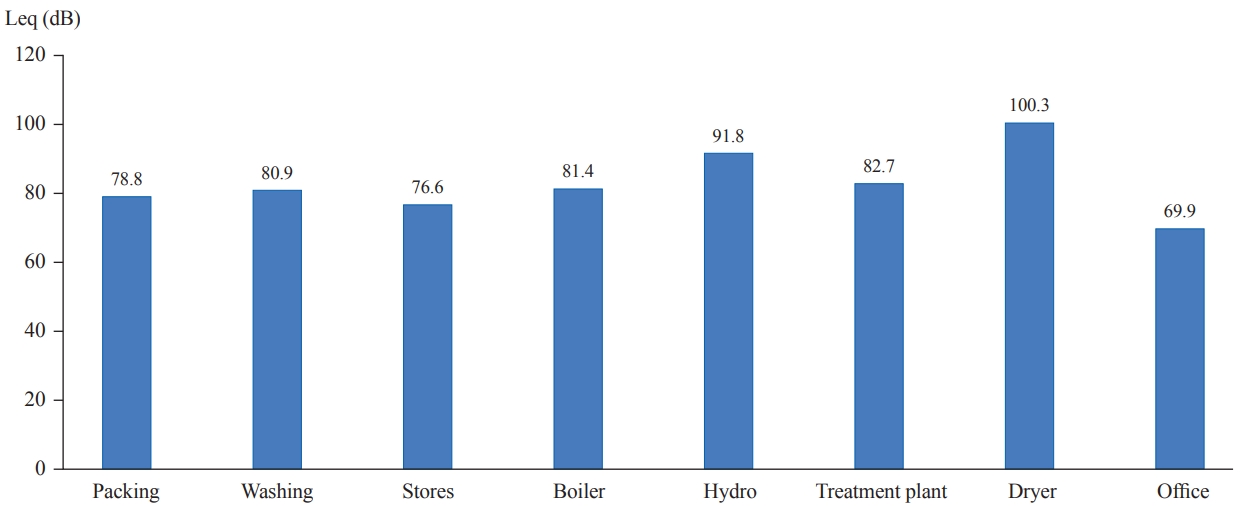
Noise exposure levels of laundry plant workers
Noise levels in the laundry plant were measured during five working days with 15-minute intervals and mathematical averages of the noise exposure level in each section were calculated as shown in Figure 1. Workers in the dryer section had the highest level of noise exposure (100.3 dBA Leq). It is much higher than the permissible noise exposure level. The loweset noise level was obtained in the office section (65 dBA Leq).
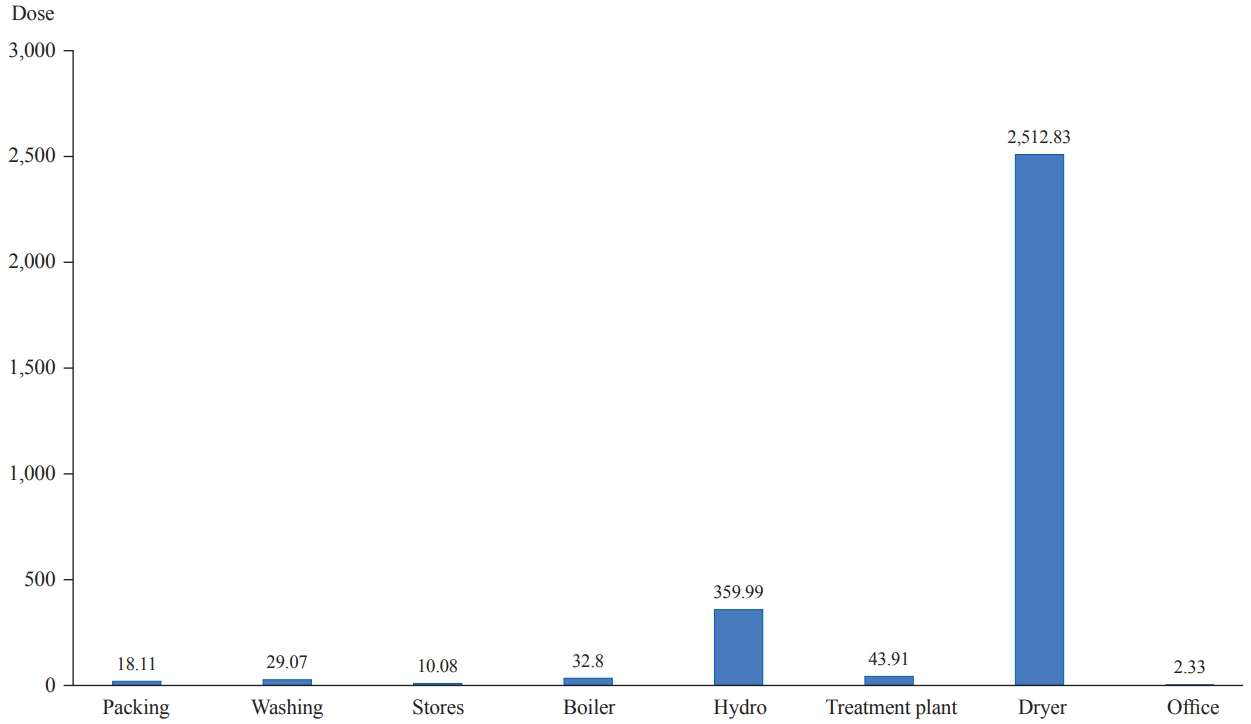
Noise dosage of the workers
As evident in Figure 2, workers in the dryer section have the maximum dose of noise exposure and workers in the office section has the minimum dose of noise exposure. Dose = [100 × T / 8 × 10 (Leq-85 / 10) % equation] used for calculated noise dose in each section.
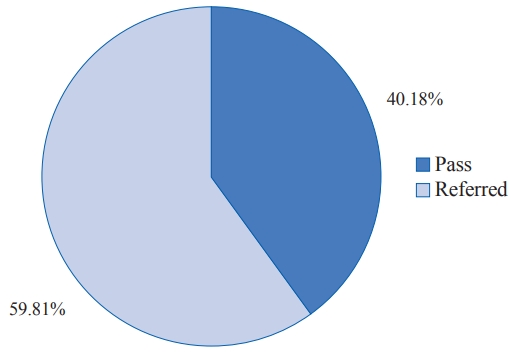
Hearing status of workers
Sixty-four workers (59.81%) were referred in the DPOAE test and they were directed to diagnostic hearing tests (Figure 3). Fortythree workers (40.18%) were found to have abnormal audiograms. Among those who had abnormal audiograms, 34 (31.77%) were found to have NIHL in the right ear and 30 (28.03%) to have NIHL in left ear. Thirty-seven workers (34.57%) were diagnosed with NIHL (Table 1; Clark, 1981).
Among the ear and frequency specific hearing thresholds, normal distribution was not observed for some frequencies in both groups with less than or more than 10 years of experience. Hence, the Fishers exact test was performed to establish the presence of a significant association between the hearing thresholds of workers with less than 10 years of experience and those who with more than 10 years of experience. No significant association was observed between the hearing status of two groups having less than and more than 10 years of experience (Table 2).
Among the ear specific hearing thresholds of each frequency, normal distribution was not observed for some frequencies in job categories of laundry plant workers. The Fisher’s exact test was performed for all frequencies, to see the presence of a significant difference between the hearing thresholds and job category. As there were limited numbers of workers in each job category who were affected with NIHL, it was impossible to obtain significant values separately for each job category.
A higher number of workers complained of difficulties in holding conversations in noisy backgrounds and headache after noise exposure. 23.36% of workers had subjective feeling of hearing impairment (Table 3).
DISCUSSIONS
This study explored measurements of noise exposure levels of laundry plant workers, evaluation of hearing related complaints of workers and assessments of hearing status by means of audiometric measures of workers. When considering the noise exposure levels of laundry plant workers, the ranges of mathematical average in each section were obtained and compared with similar values of previous studies. In this study, the highest noise levels were obtained in the dryer (100.3 dBA) and hydro sections (91.8 dBA), which were comparable to the findings of Fontoura et al.(2014), which state that the noise level per area and service vary such as in pre-wash area 89.8 dBA, washing area 89.8 dBA, spin drying 99.0 dBA, afterwash area 85.0 dBA stores 84.0 dBA, sorting out clean clothes and clothe folding area with noise levels of 86.1dBA in both stations and compressed folding area 77.0 dBA. The findings of this study evidenced that the laundry workers are exposed to noise levels between 77.0 and 99.0 dBA. In this study, the noise exposure range was between 63.1 dBA and 100.3 dBA and washing area 80.9 dBA, stores 76.6 dBA and after-wash area 78.8 dBA. In a similar study at a hospital laundry, measured noise levels in several sectors of the laundry were between 70~101 dBA (Silva et al., 2011) which is similar to the findings of this study.
The findings of this study indicated that there is a statistically significant difference between hearing status and exposure duration which is comparable with the findings of Fontoura et al.(2014) which revealed that the duration of experience in years plays no significant contribution to hearing loss. Elias et al.(2003) stated when considering the duration of noise exposure, laundry workers showed significant NIHL in the first decade of the exposure, which is contradictory to the findings of this study. This may be due to confounding factors for occupational noise exposure such as exposure to transportation noise and recreational noise exposure. Study findings indicated a statistically significant difference between hearing status and job category which were comparable to findings of Fontoura et al.(2014) which revealed no correlation between work area and NIHL.
The findings of this study have established that there is a predisposition for hearing loss among laundry plant workers as the mean Leq levels exceed the 85 dBA action level recommended by the OSHA in dryer section and hydro section. When considering the calculated noise dosage of the workers, dryer section workers, and hydro section workers have the maximum noise dosage. 43.92% of the laundry plant workers have been diagnosed with hearing impairment and 56.07% of workers have normal hearing sensitivity. Among the workers who have been diagnosed with hearing impairment, 57% have the audiometric notch at 6 kHz, 9% at 4 kHz, 2% at 3 kHz, and 32% of workers did not exhibit any type of audiometric notch.
There is no association between the degree of hearing loss and exposure duration of the laundry plant workers as well as hearing status with reference to the job category, as it is a complicated process there can be variables such as individual susceptibility, exposure to transportation noise while travelling to work, recreational noise exposure which may have added an effect on the noise exposure experienced by the laundry plant workers. 38.31% of workers complained of conversational difficulty in background noise and 31.77% of workers complained of a headache after being exposed to noise. It can be concluded that laundry plants are hazardous settings for workers leading to NIHL, if no preventive measures are taken. It is important that hearing conservation programs are implemented and adopted for these settings.